
This post will demonstrate a way to bring Searchmetrics data to both Google Sheets and Google Data Studio using the Supermetrics add-on. Supermetrics and Searchmetrics don’t just have similar names – they make a great team too. Searchmetrics provides a huge quantity of helpful search and content data. Supermetrics lets you easily report and analyze it.
Why combine Searchmetrics & Supermetrics?
Both companies’ founding motivation was to save time through automation. Needless to say, it’s in our interest to save you even more time by bringing these two together.
Supermetrics makes reporting and analyzing online marketing data easier, providing tools for Google Sheets, Google Data Studio and Microsoft Excel. Since their launch in 2009, they’ve managed to go from connecting Excel with Google Analytics to enabling integration with practically any tool an online marketer could possibly want or need. Check out their website!
Why use Searchmetrics data outside the platform?
Searchmetrics provides an interface that lets you analyze, report and interact with search and content data. Furthermore, it allows the creation of custom dashboards that can be regularly assessed or be sent out as an email report. So why would you ever work outside of the platform? You may wish to:
- Share reports with audiences that don’t like logging into the Searchmetrics Suite.
- Combine data from different sources.
In these situations, you turn to one of the many data visualization and spreadsheet tools on the market and create an awesome dashboard like our Senior SEO Consultant Felix did – check out his article on setting up a brand vs non-brand dashboard based on Searchmetrics data that he downloaded as a CSV file. This is easy, quick and a great way to start and visualize an ad-hoc analysis.
Weekly updates = weeks of work?
But what if you want to update your SEO dashboard every week? What if it includes data from 7 different sources? Assuming it takes three minutes to download and update each one of them? That’s 105 minutes every week. That’s two weeks in a year! This is when your colleague starts telling you to simply use an API and you start wondering what the hell that is.
What the hell is an API?
APIs are often seen as magical problem-solving black boxes and that is probably because they are. In the case of online marketing tools, APIs let you generate or simply access the raw data and use it in any format you want. This is why we built our Searchmetrics API: It lets you query the search volume of tens of thousands of keywords and load all your project rankings in no time. The only problem is that to take full advantage of an API you often need to know how to code. At times though, if you’re lucky, there is an existing add-on that does the work for you. Supermetrics lets you run API queries by simply putting in the information about what data you want to look at. Here’s how:
Step 1: Getting started with Supermetrics for Google Sheets (for Searchmetrics)
- When opening a Google Sheet, click on “Add-ons” > “Get add-ons…” and search for “Supermetrics”. Click on the “+Free”-Button to install the add-on.
- Click “Add-ons” > “Supermetrics” > “Launch sidebar” to start using the add-on.
- Once you’ve successfully launched the sidebar, select Searchmetrics as your “Data Source” and add a new account. You’re now being asked to put in you API key + secret. You can find your credentials in the Searchmetrics Suite under “Settings” > “My API”. Click “create new API key” if you haven’t done so before and then copy paste both values and press “login”.
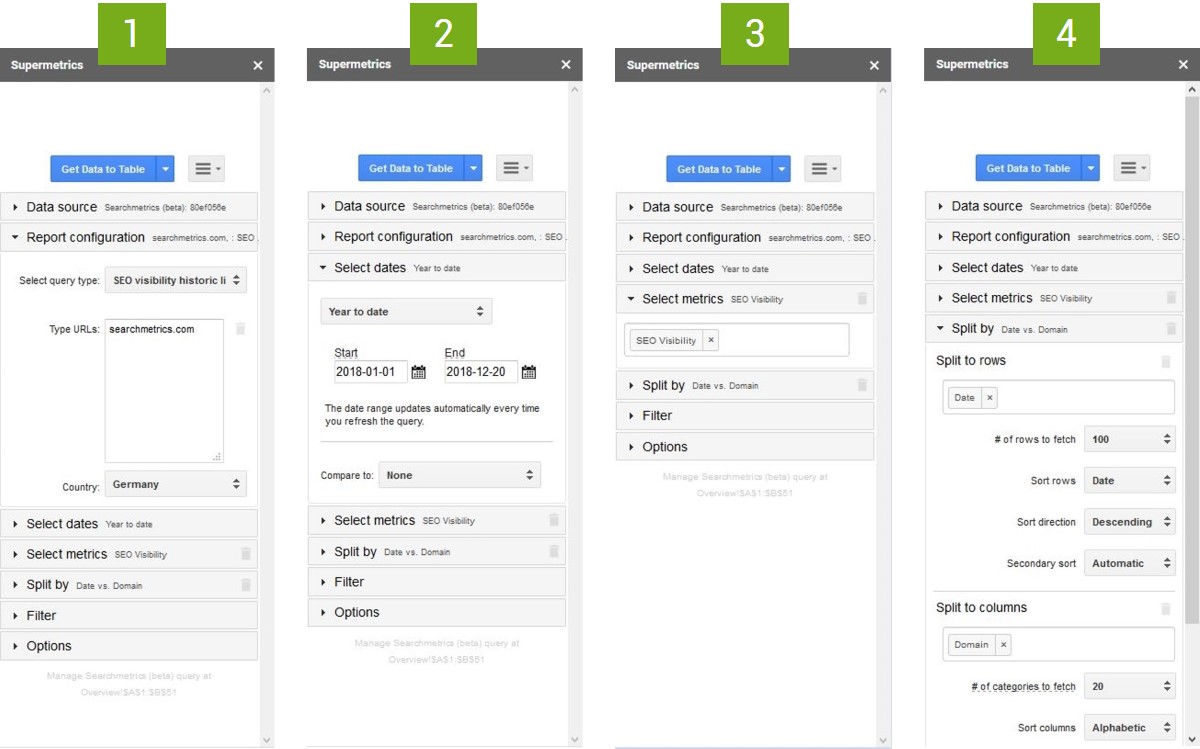
Step 2: Setting up a query for the Research Cloud SEO Visibility in 4 steps:
- Select “Report Configuration” and the query type “SEO Visibility historic list”. Type in the domains you want to analyze and the appropriate country.
- Select the timespan. Supermetrics gives you a couple of pre-defined date picker options. If you select one of them, it’ll automatically adjust upon refresh.
- Select the metric (in this case “SEO Visibility”).
- Define and select what should be displayed as rows and as columns. “Split to rows” > “Date” and “Split to columns” > “Domain” works best in most cases.
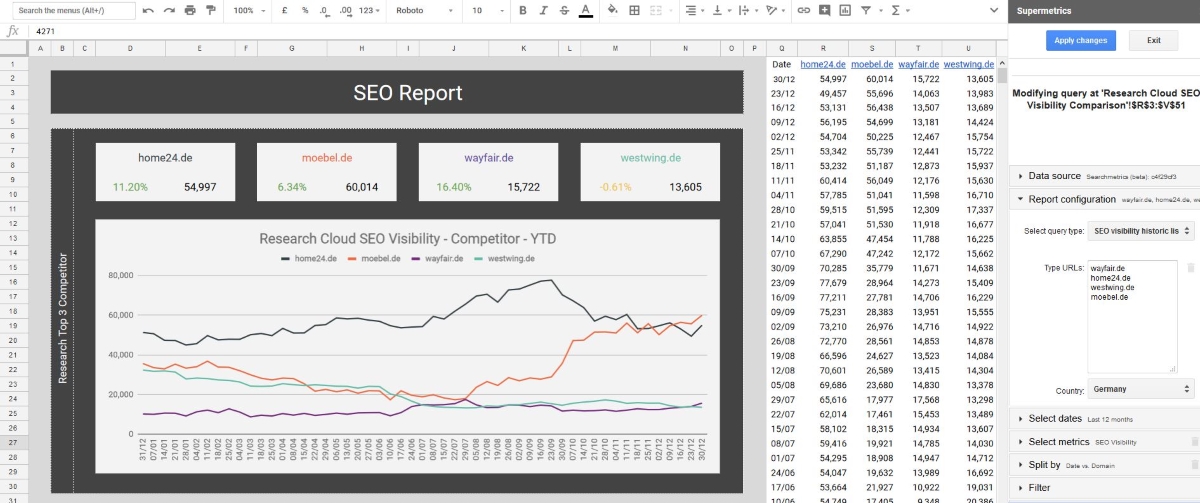
Now when you click “Get Data to Table” the SEO Visibility for the selected domains will be loaded to the spreadsheet from where you can easily create a chart:
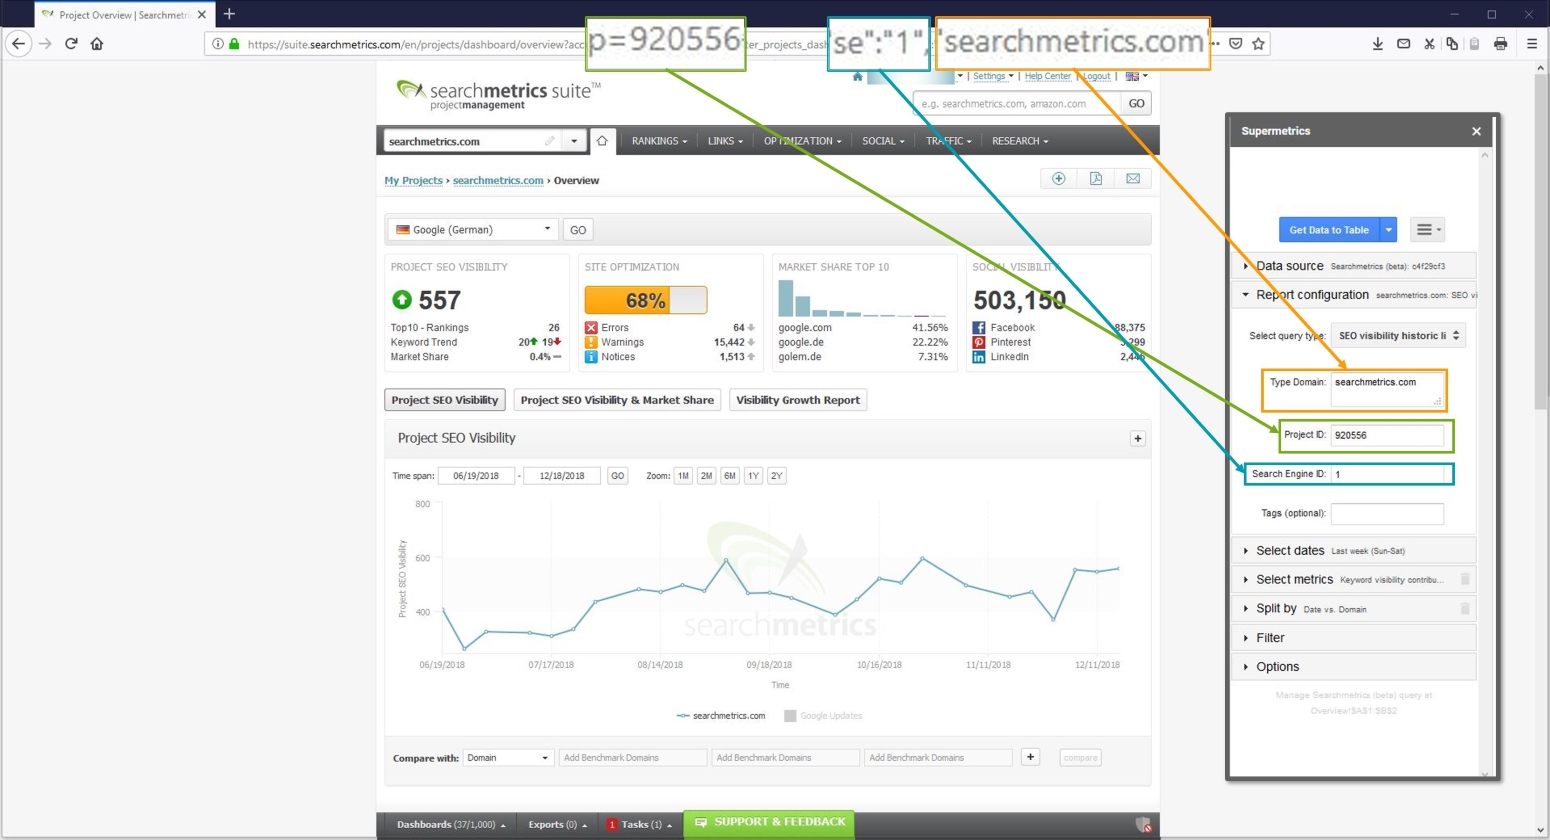
The add-on includes selected metrics from the Research Cloud and from Project Management. When querying project data, the quickest way to get the right parameters is to copy them from the URL.
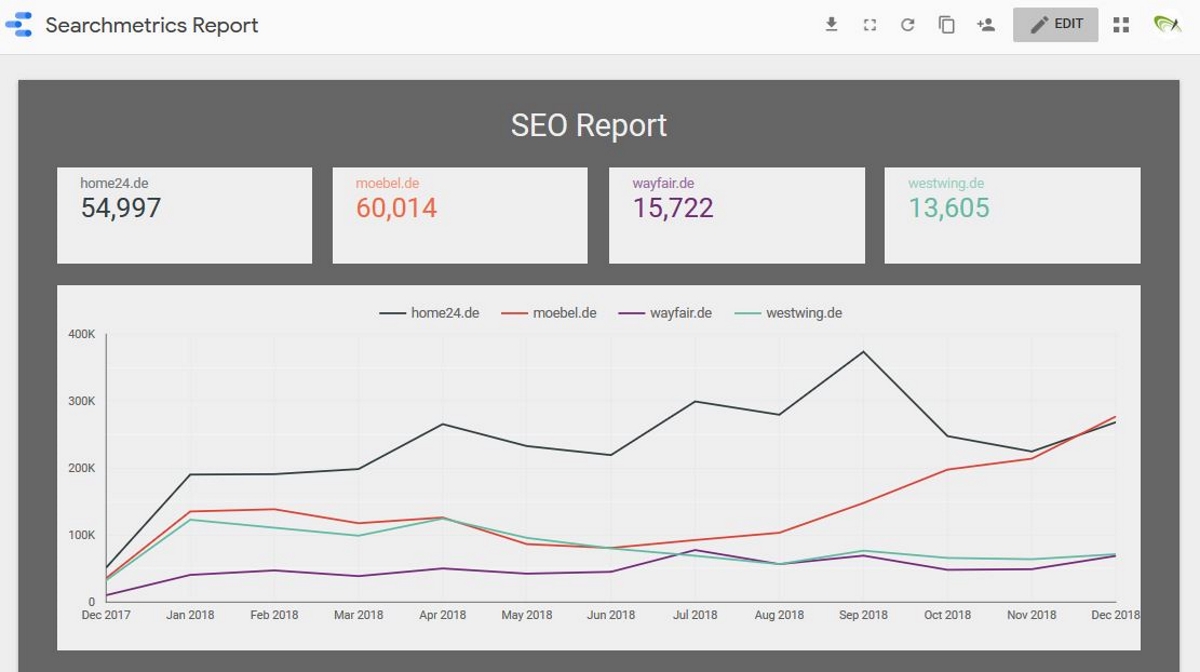
Step 3: Connect Google Sheets to Data Studio
Another particularly helpful option is the ability to set up a Google Sheet as the Data Source for Google Data Studio. This means that using the plugin allows you to not only automate your Google Sheets, but also your Google Data Studio dashboards:
More tips and advanced dashboards
Having an easy way to pull Searchmetrics data is great but it’s not all the plugin can do. Here are some helpful tips for working more efficiently with Supermetrics:
- Want to refresh or edit a query? Just click in the cell range containing the data and the plugin automatically detects which query you want to edit.
- Want to finalize the automation of your report? Select “Schedule refresh & emailing” from the hamburger menu in the top right.
Ready to move on to create more advanced dashboards? Combine data in Google Sheets, display it in Google Data Studio and let us know what you think in the comments below!