The number of Universal Search Integrations, — Images, Videos, Maps, and News, Shopping (PLAs) — in search results, has once again significantly increased over the past year. Above all, shopping snippets have increased considerably. And it seems that several of these changes are connected to the Hummingbird update that took place in the late summer of 2013.
As in past years, we once again closely observed the developments of the integration of Videos, Images, Maps, Shopping, and News in search results in 2013. We did this neutrally (i.e. without personalization) and in great detail. And, as is the case every year, once again there are several changes to the universal search integrations. After a lull in 2012, the number of these additional appearances has grown again. Drivers here were Videos and Images – and Shopping also increased. The counted integrations of Maps and News remained the same. However, news integrations exhibited an interesting connection with the Hummingbird update.
All results of the study are included in a white paper that is available here:
Universal Search 2013 – Google USA
An overview of the results of the study:
1. Video integrations
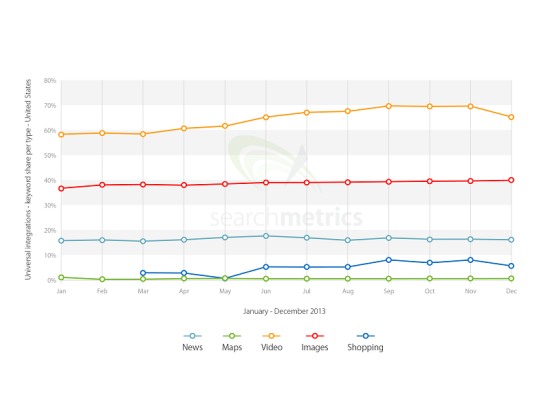
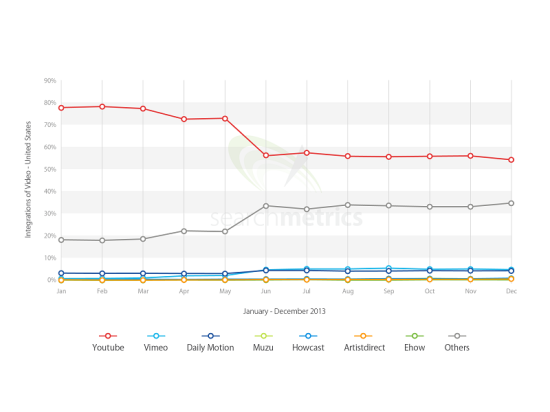
What’s very striking – and surprising – is the development in Videos: While the absolute number of integrations has fallen, and the keyword share has risen, we have found fewer YouTube results than the year before. However, this does nothing to change the fact that with 50 percent, YouTube has the most Video integrations in the Universal Search by some distance.
There has been an increase in Videos stemming from smaller portals like Vimeo, Daily Motion, etc. After the dominance of YouTube over the past few years, Google now seems to be focusing on greater diversity in its search results, as this chart shows:
One detail that stands out in the study results is Google’s own market power in terms of YouTube. If you take a look at the average first positions of Videos in search results, the YouTube videos are, on average, two places above the first position of a competitor. So, not a great deal has changed here compared to the previous year.
2. Image integrations
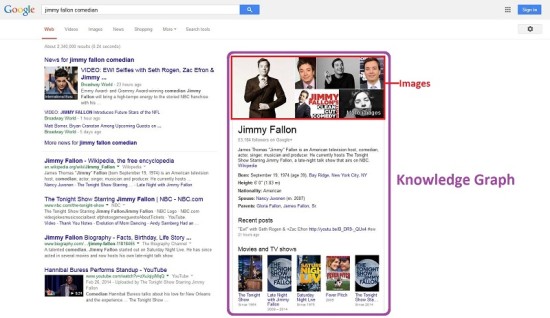
The proportion of Images in search results has moderately risen in terms of keyword share – but is apparently moving away from the traditional image bars between search results pages. Rather, the images are ever increasingly integrated into the Knowledge Graph.
However, this also appears to be a reason why fewer Images were counted in the Universal Search in total. In the Knowledge Graph there is often far less room than between the organic search results where the images are generally shown alongside one another.
3. News integrations
The number of News appearances in search results has remained almost unchanged. However, this can be structurally explained. News results appear with the keywords that Google knows are current on that day. Therefore, it makes sense that these only account for a small part of the overall quantity of keywords.
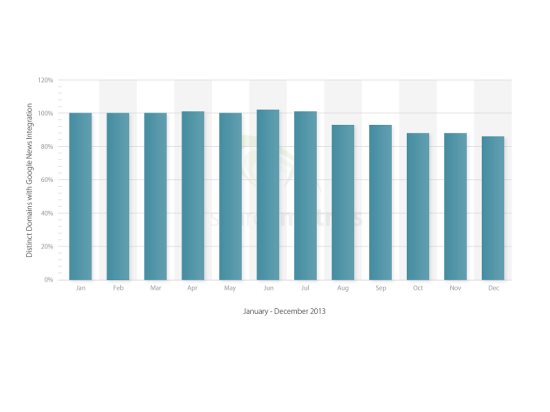
However, what is interesting is the development of the number of News sources, i.e. the pages that are displayed therein. And this is precisely the figure we have inspected. It seems it’s more difficult for News providers to meet Google’s criteria and to get listed as a News result in the SERPs, which has slightly reduced the number of News sources.
This development roughly coincides with the publication of the Hummingbird update last year. However, this is not specific to News results. In spite of higher complexity of search queries that the Hummingbird update is supposed to be able to cover, fewer different pages can be found even in organic search results. More on this here.
4. Shopping integrations
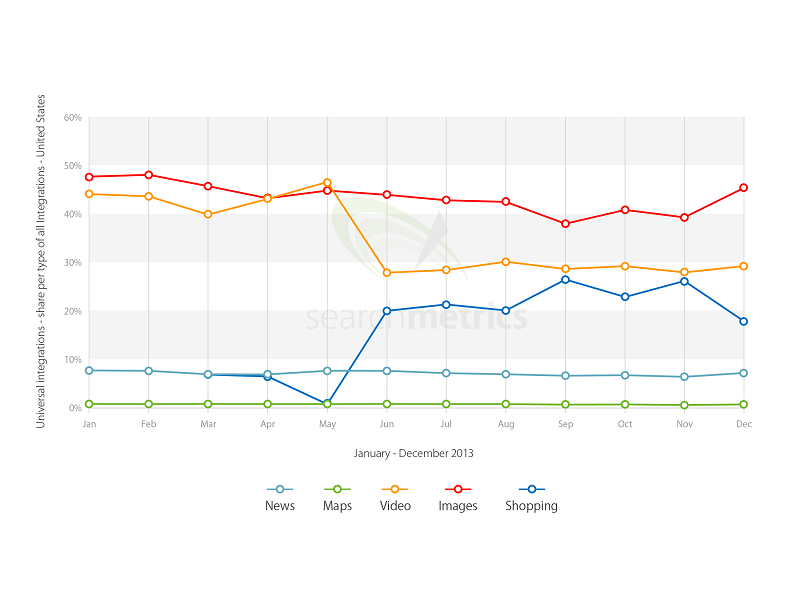
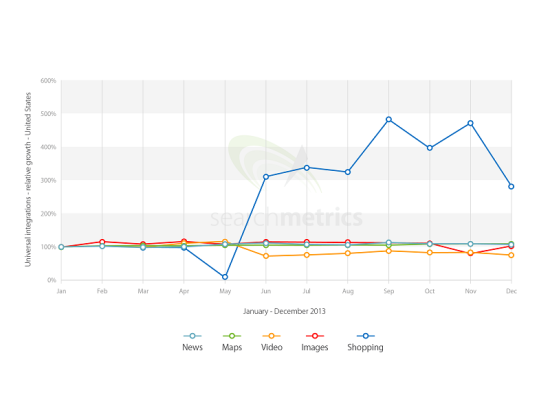
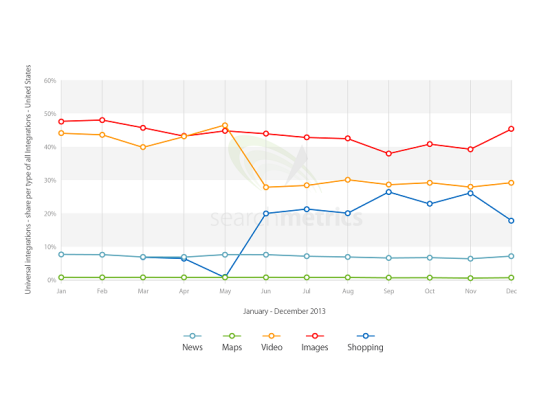
The Shopping integrations very clearly increased. This is due to the Google Shopping payment model that left its beta stage in February 2013. It therefore comes as no surprise that now only Google’s own PLAs (Product Listing Ads) are displayed and there are no longer any competitors. Here is the development of the integrations in a percentage:
However, the very significant increase of Shopping nearly matches the reduction in Videos. Even if you look at the absolute number of integrations in the SERPs. We not only looked to see if we could find ONE integration – but how many individual Videos or products were displayed and then calculated the share as 100% (=total). The curve progression is astounding:
The periods between May and June and between August and September are of particular interest. In both intervals a growth of Shopping at the expense of other integration types is clear.
What really surprised us is that what appears to be very stable at a first glance (e.g. the news integrations) becomes extremely fascinating on closer inspection. It is no longer enough to simply analyze the share of integrations. It is increasingly important to research the absolute number of integrations, the relative changes and the correlation with other Google developments. And that is precisely what we will continue to do.
Get Even More Detail
