With Research Cloud, we’ve completely reinvented our software’s research section to give you a convenient overview of all the important metrics on the performance of any domain. But we wouldn’t be Searchmetrics if we didn’t have more!
Our brand-new, and revolutionary Content Performance solution, lets you now check your metrics, including holistic content KPIs, on a detailed page-level and who’s outperforming you. It’s the most comprehensive and fastest analyzes, on demand, in the industry – saving you time and money!
With the touch of a button, evaluate landing pages for every single website available in the world’s largest index here.
Research Cloud + Content Performance: Get started
UPDATE 10 August 2015: We have now integrated two further countries into the Research Cloud: Hong Kong and Singapore. In addition, Content Performance is now available for all countries currently using Research Cloud. This means that data analyses for every domain, as well as ad hoc optimization and competition comparison, is now available for a total of 26 countries.
First of all: What is the Research Cloud?
Research Cloud is not just a new feature; it is your door to our complete data and knowledge repository. We have completely revised our research area in the Searchmetrics Software. Just enter a domain into the search field and you’ll receive all the relevant metrics instantly in one sleek overview page.
Research Cloud including Content Performance is your gigantic telescope, enabling you to discover the online universe of infinite content and webpages. The central idea behind the development was to answer two questions in one overview: “Where am I currently positioned?” and “What can I achieve?”
The new Research Cloud makes the important metrics of a domain available to not only SEOs, but also to editors and marketers in the area of online marketing and content. The foundation of this new feature is the Searchmetrics data pool which includes billions of pieces of information on over 100 million domains, SEO, PPC, content, backlinks, and social data, making it the largest index in the industry with the most historical data.
Before we go through the features one by one, I want to present you with the biggest game changer – Content Performance!
Content Performance – the real game changer!
The Research Cloud update was not just a facelift. We wanted to create a better overview, which shows the performance of a domain with all the relevant metrics, but also create something completely new. As a result, we have integrated Content Performance, a unique solution for the analysis of individual landing pages, into the Research Cloud.
Holistic content instead of single keywords
Forget the focus on keywords; that was the “old” search experience optimization. Now with Content Performance, we give you a solution that puts a specific landing page URL at the center of your analysis. It is the only solution in the entire industry to carry out holistic performance analyses based not only on a keyword, but also on a URL.
With Content Performance, not only can you analyze your own web projects on a URL basis, you can also better understand your competitors’ web projects.
For every. Single. Page.
Analyze your market environment on a page level and use your competitions’ content strategies to your own advantage in just a few seconds.
Content Performance: Test The Game Changer
Landing pages from all domains in our world-leading index of hundreds of millions of domains can now be analyzed in-depth.
Overview: Benefits of Content Performance
With Content Performance we give you a solution that puts a specific landing page URL at the center of your analysis.
-
What are the benefits of Content Performance for me?
With Content Performance, you can not only analyze your own web projects on a URL basis. You are also enabled to better understand your competitors’ web projects. Analyze your market environment on a page level and use your competitions’ content strategies to your own advantage within just a few seconds.
-
Why is it important to analyze on a URL level?
Holistic content is the foundation of online success. Landing pages that rank well on Google are often pages that are optimized for not just one keyword, but rather a wide range of topics and topic clusters with a user-centered approach. That’s why it is less important today for content marketers, CMOs and SEOs to know the impact of an individual keyword but rather to analyze the topic performance of the individual landing pages. This is especially relevant for eCommerce brands as this will have a direct impact on transactions.
-
How does Content Performance save me time & effort?
Content Performance is an easy and efficient way to carry out analyses ad hoc for all websites within Searchmetrics’ world-leading data base. Previously, detailed URL analyses had to be performed in the project area, where your own web project had to be defined in terms of keywords as the basis of your analyses. This is still one of the basic measures if you know your strategie and your keywords. We want to help you decide which landing pages should be right at the top of your optimization list. To do so, we’ve integrated insights in Forecast and Value, which is the only solution in the entire industry. Furthermore, you can analyze which sub-topics your top URLs can rank even higher for and generate more traffic. After analyzing, you can directly switch to the Content Optimization section to start improving page content.
-
How can I analyze my competitors?
Imagine analyzing your competitors ad-hoc on a page-based level to discover their content and marketing strategies just with the touch of a button. You think you are dreaming? Welome to Content Performance! With the help of Content Performance, competitors and/or similar pages can now be analyzed on a URL basis for the first time, making it easier to look at a competitor’s content and SEO strategy. It’s the only solution in the entire industry to give you all these answers within seconds:
- What is my main competitor’s top page?
- Which backlinks refer to this top page?
- Which keywords are my competitors ranking for?
- Are there perhaps special secondary keywords that a competitor is also targeting?
- Which of their backlinks have the highest page strength?
- What’s the social strategy of my main competitor?
Content Performance explained with an example
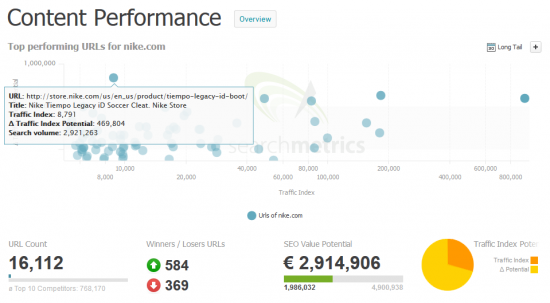
Let’s take a look at the new Content Performance of nike.com. On the overview page, discover the top pages, including all numbers for keywords, position, backlinks and social distribution, as well as the potential in traffic index and SEO value.
There are a lot of pages that have actually not that much traffic, but a lot of potential. One of the URLs with the highest potential is the landing page for the Nike Tiempo Legacy boots. Let’s start analysing and optimizing this page!
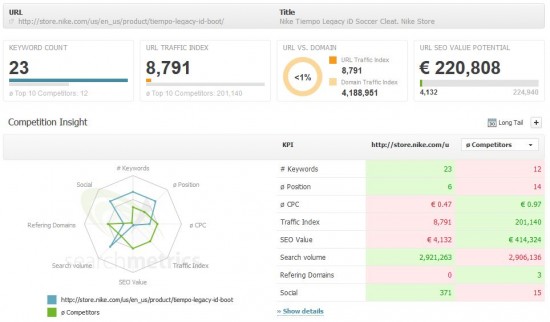
On the detail page, we get all the relevant KPIs and a comparison with our hardest competitors for the rankings for this specific page. Now, you can compare our page with specific competitors, for example with regard to the number of keywords, position, CPC, search volume, referring domains and social distribution – and with regard to the traffic index and SEO value. With the potential in SEO value and traffic you have a database for strategic decisions because now you know which of your own pages should be optimized first – or which content strategy your competitor is adopting.
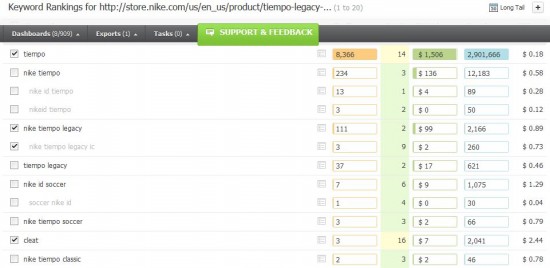
On the lower part of the detail page, you get all the keyword ranking for the specific landing page. Here, you can decide which keywords are the ones with the most traffic potential. By setting the check box, you can choose the keywords you want to transfer in your own project for observation, or you can start directy a Content Optimization from this page.
Content Performance: Test The Game Changer
The Research Cloud: All the features one by one
On this overview page you can discover the whole “story” of a website with the help of our features:
-
Mojo and Desktop vs Mobile Visibility
At the top of the page, you’ll find our mojo as well as the Desktop and Mobile SEO Visibility. By using mojo, you can see at one glance if a domain is, for example, strong in search traffic, but maybe underperforming in social networks.
Research Cloud Search and Content Database
-
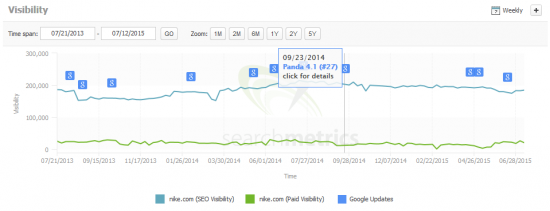
Visibility and Google Updates
Just below the mojo is the graph for historical SEO visibility and Paid Visibility. As a free user, you can check the last 3 months. Become a registered user of Searchmetrics, and get years of historical Visibility to analyze. For the launch of Research Cloud, we implemented a new Feature: Google Updates. When activating it, you get an instant overview of all Google Updates in the past – klick on the blue “g” to get more information, including a link to the related blog post. As an example, take a look at the historical Visibility of nike.com:
-
Geography
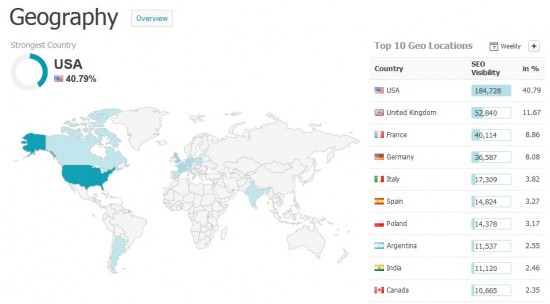
The Geography area is brand new. In the case of multinational pages, the feature can show you the country-specific visibility and consequently, global visibility differences. Because Searchmetrics is the world’s leading platform in search and content performance, we can offer you detailed analyses from a lot of countries. With regard to nike.com, you can see that the US market is the strongest for nike.com, followed by UK, France and Germany.
-
Rankings
In Rankings you can find the national SEO Rank or PPC Rank of your domain, as well as the quantity, value, and position of keywords for which the domain ranks (or pays for in the PPC area). This allows you to see the keyword distribution of a domain and the relationship between SEO and PPC behavior. It also gives insights into which keywords competitors’ might be paying for since these would most likely be keywords that have a low organic search ranking but perhaps have a very high PPC position— exciting information from a sales perspective.
An overview of the most important keywords and a winners/losers list have been added. This makes the Research Cloud a valuable platform for answering ROI-specific keyword questions – such as which keywords generate the most weekly traffic, or which keywords have over or underperformed in the past week.
-
Mobile Performance
Mobile Rankings offer you a comprehensive look at the mobile performance of a domain, which has grown in importance since April 2015 when Google began punishing websites for not providing a good user experience on mobile devices. In the mobile page, you can find a historical comparison of Desktop vs. Mobile Visibility. Furthermore, just like in desktop rankings, the mobile rankings page also displays the top keywords for mobile and an overview of the winning/losing keywords.
-
Content Performance (see above)
-
Market Analysis and Industries
Market Analysis gives you the tools to do a quick competitor analysis. In the Industries section you can find how each keyword ranks within a specific domain. This allows brands to better understand how they stack up against their competitors in the organic search competition and with the same keywords and corresponding traffic. These keywords and traffic analyses can be displayed for every competitor and economic sector on an SEO and PPC level. Individual comparisons with individual competitors are also possible here.
-
Links and Social
We want to offer you a holistic view of your performance with the Links and Social sections. In the Links section you receive a quick overview of the most important backlink figures. The Social area is an overview of your domain’s Social Rank, Social Signal quantity, and visibility across social platforms such as Facebook, Google+ or Twitter.
-
Ranks
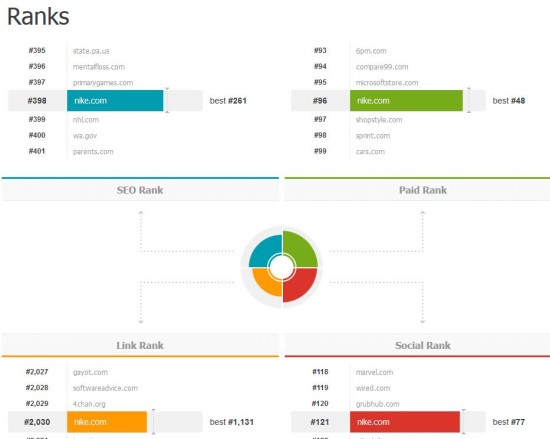
At the bottom of the Research Cloud page, you get a detailed view on the mojo chart from above. Like a summary, you get all the ranks at one glance.
With regard to nike.com, you can easily compare SEO and PPC Visibility – their PPC rank (#96) is higher than their SEO rank (#398). It’s also obvious that nike.com is strong at Social – rank #121.
Who is Research Cloud and Content Performance available for?
We are making the Research Cloud available to all customers as an overview page for the performance of a domain. It will offer a fast and relevant overview of a website. However, the Mobile Performance section and the new Content Performance feature are only available for Suite customers. Learn more about packages and get a demo here:
Research Cloud + Content Performance: Get started
Do you have any questions or comments on Content Performance or Research Cloud? Let us know in the comments below!

