
This year we introduced a brave new type of infographic in our annual Ranking Factors Study. We are really pleased about all the positive feedback we received for the deck of cards design. Nevertheless, many friends of Searchmetrics have expressed difficulty in correctly interpreting it. Hence this post. Let us briefly delve into the curious, sometimes spurious world of correlations. And, for the read-to the-bottom readers, there is a little surprise at the end.

Instead of the familiar correlation bar chart, ordered by correlation values, this year we have chosen a different format. Instead of by correlation, we have ordered and grouped the ranking factors by overall importance for Google rankings.
Download Ranking Factors Study
What is correlation?
A correlation is a relationship between two variables (in our case ranking factors) and can be expressed as a value. In general, values range from 0 (no correlation) to 1 (strong correlation). However, correlations can also be negative (-1).
 Example: in summer ice cream consumption increases. Compared with other times of year, the ratio of people with sun burn in summer is also higher. Both increases occur at the same time and occur less often at similar times (e.g. winter). We could say that these factors correlate with one another (in this case temporally). Often, however, strong correlation of this kind is misinterpreted as a causal relationship.
So does eating an ice cream lead to sun burn? No, of course not. It is only the degree of temporal similarity that correlates highly between the factors ice cream consumption and sun burn. However, this does not mean that there is a causal relationship. Instead this is an example of a spurious relationship.
Examples of spurious relationships
The following amusing examples will illustrate what is meant by spurious relationships (we took them from here). In each case, we look at two variables over time that exhibit a high level of similarity in their respective values, meaning they correlate highly.
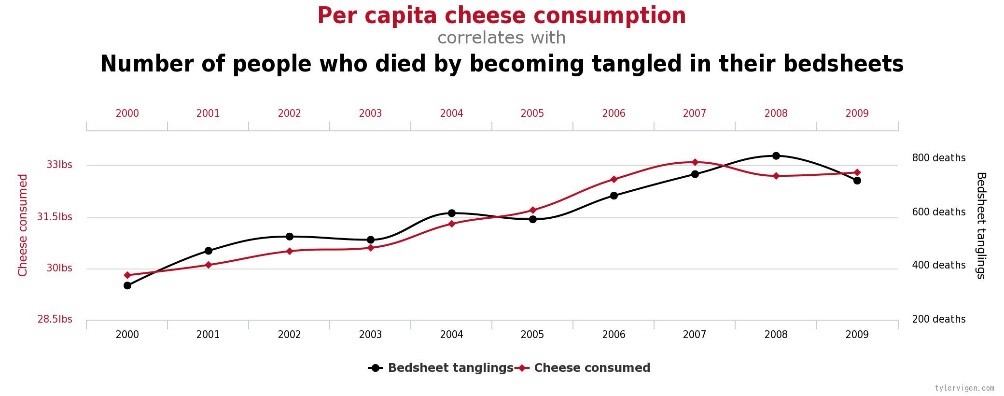
Above, per capita cheese consumption correlates highly with the number of people who died by becoming tangled in their bedsheets. The correlation of 0.95 is extremely high. But is there really a relationship between cheese and bedsheet deaths? Hardly.
Another example? Sure thing:
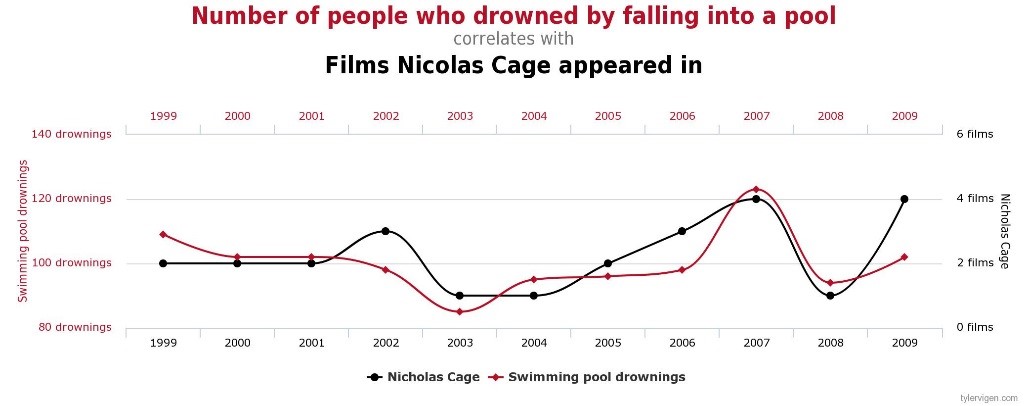
Here is the relationship between the number of people who drowned by falling into a pool and the number of films Nicolas Cage appeared in per year. The correlation is very high at 0.67. Does this mean that more Nicolas Cage films lead to more people drowning in pools? Nope. And does this have anything to do with Nicolas Cage’s prowess as an actor? We couldn’t possibly comment.
Ranking Factors: Correlation vs. importance
This problem of false conclusions and spurious relationships is something we want to avoid in our study. We interpret the correlation of ranking factors as ranking correlation coefficients and attempt to interpret and evaluate their significance by analyzing the corresponding averages and values.
More on this here: What is a Ranking Factor?
Nevertheless the infographic from previous years has been interpreted as if bar length were equivalent to importance – not true. I.e. because correlation of social signals is very high, likes & shares were interpreted to be correspondingly important for a top Google search result ranking – not necessarily true.

The range of the Spearman correlation which we use is -1 to +1. A correlation of 0.28 as here in the Facebook likes & shares is comparatively high, however, this is not directly related with the importance of this ranking factor. Instead this high correlation “only” means that the differences between the analyzed pages with respect to this variable are high, i.e. on average pages that rank higher have more social signals.
Problem: False interpretation of correlation as importance
A negative correlation, as in the following example, shows that the inverse is true with respect to the rank order. The ratio of links on a homepage was, on average, highest at the bottom of the rankings of the analyzed pages (the very top ranked pages – often homepages – form an exception.) This does not imply that this ranking factor has a negative effect on rankings.

The deck of cards – our new infographic
For readers that are not very familiar with correlations, this differentiation can be difficult. And this is one of the reasons why we did not use the familiar correlation bar chart. We wanted to avoid the fallacy that longer bars = more/greater importance.
So this year we decided on a deck of cards. And alongside the correlation value, an overall importance rating (Searchmetrics’ interpretation and not to be confused with correlation value) is given to the individual ranking factors, as follows:
- -1 = negative impact
- 0 = no impact
- 1 = positive impact
- 2 = highly positive impact

Additionally, we have sorted each of ranking factor category by importance. The order from most to least important is as follows:
- Clubs – Content (most important)
- Spades – User Experience
- Hearts – Technical
- Diamonds – Backlinks (least important)
(Social links are presented as a bonus category)
And within each category the individual factors are also sorted by importance from 7 – Ace (low to high). For example, within content, “keyword in description” is the least important; the most important factor here is “relevant terms”. Obviously we could not include every factor in the deck of cards, we concentrated on the most important. We analyze about 200 factors, of which only a selection make it into the study and the infographic.
Got it? Good. So, let’s find our example of ratio of links to home page from above in the infographic. There it is – the 10 of diamonds. This means it finds itself in the least important category, backlinks. With its suit rank of 10, it is of middling importance within this category. We also see it has been allocated an overall importance rating of 1, meaning that Searchmetrics would expect this factor to positively impact rankings. Interestingly, and as discussed above, the negative correlation of -0.06 does not affect its overall importance.
Brief note of the deck:
Wait a second. Why does the deck only have 36 cards? Good question. Our special edition card deck is based on the German national card game Skat. (The perfect time to add a new card game to your repertoire. As with many things German, a real-life German supervisor or friend is advised.).
New: Rank correlation graph as a download
So read-to-the-bottomers, here’s your reward. Many of you sent heartfelt pleas asking for the old correlation chart and we couldn’t simply ignore this. So we have once again lovingly created the bar chart with this year’s data. And now that we have cleared up possible problems in interpretation, you know how to handle it. This time we have not sorted the factors by correlation rather by category. You can also find our interpretation of overall importance on the chart.

If you want to get the chart in a higher (and printable) resolution, then we have added this image to our Ranking Factors Infographic page for you to download.
Do you have any criticism or feedback about our Ranking Factors Study or this post? Let us know in the comments.