
What do Netflix, ebates.com and thesun.co.uk have in common? They’re among the top 100 domains that enjoyed rich rewards in 2017. Which domains took the biggest hits in search Visibility? Searchmetrics in our annual Google Winners & Losers study dived into our data to uncover the top 100 winners and the biggest losers, analyzing their performance in the context of the most significant search trends and changes of 2017 – including Google Updates, mobile index and content quality.

The data
For this study, we analyzed the development of SEO Visibility for all domains listed in our US index tracked over the course of 2017. The list is ordered according to the absolute increase or decrease seen by the website, when comparing the level at the end of 2017 with that of January 1st. We have filtered out adult and illegitimate streaming sites, as well as domains that have migrated.
Top 100 Winners in 2017
Publishers and encyclopedias were the SEO Visibility success stories of 2017. More than half of the top 100 winners on Google.com regularly publish articles on general interest topics, tech or video content as their core business. The runner-up category in 2017 was encyclopedias (including dictionaries, translation sites etc.), who saw enormous increases in their SEO Visibility over 2016.
| Rank | Domain | Gain of SEO Visibility absolute | Gain of SEO Visibility in % | Industry |
| 1 | youtube.com | 1890062 | 8% | Media&Events |
| 2 | merriam-webster.com | 1530828 | 43% | Encyclopedia |
| 3 | wikia.com | 1499434 | 60% | Encyclopedia |
| 4 | dictionary.com | 1461674 | 37% | Encyclopedia |
| 5 | wiktionary.org | 1402039 | 77% | Encyclopedia |
| 6 | thebalance.com | 1242337 | new | Media&Events |
| 7 | britannica.com | 1178391 | 122% | Encyclopedia |
| 8 | thesaurus.com | 1128342 | 121% | Encyclopedia |
| 9 | genius.com | 1017911 | 162% | Other |
| 10 | imdb.com | 938491 | 11% | Media&Events |
| 11 | usnews.com | 934378 | 122% | Media&Events |
| 12 | glassdoor.com | 833539 | 101% | Jobs |
| 13 | thespruce.com | 789330 | new | Media&Events |
| 14 | netflix.com | 641224 | 298% | Media&Events |
| 15 | tripadvisor.com | 537854 | 25% | Other |
| 16 | softonic.com | 529229 | 75% | Other |
| 17 | collinsdictionary.com | 506015 | 466% | Encyclopedia |
| 18 | cambridge.org | 497174 | 59% | Other |
| 19 | ebates.com | 494899 | 1191% | Shopping |
| 20 | thoughtco.com | 474379 | new | Media&Events |
| 21 | tvtropes.org | 472487 | 176% | Encyclopedia |
| 22 | theguardian.com | 470823 | 35% | Media&Events |
| 23 | target.com | 470572 | 43% | Shopping |
| 24 | oxforddictionaries.com | 459019 | 57% | Encyclopedia |
| 25 | geniuskitchen.com | 451083 | new | Media&Events |
| 26 | spotify.com | 433896 | 65% | Other |
| 27 | usatoday.com | 417641 | 43% | Media&Events |
| 28 | thesun.co.uk | 411011 | 344% | Media&Events |
| 29 | lifewire.com | 388797 | 53% | Media&Events |
| 30 | urbandictionary.com | 380528 | 18% | Encyclopedia |
| 31 | mapquest.com | 369930 | 49% | Other |
| 32 | washingtonpost.com | 354692 | 35% | Media&Events |
| 33 | poki.com | 327492 | 186% | Other |
| 34 | cnbc.com | 321863 | 56% | Media&Events |
| 35 | healthline.com | 315664 | 27% | Media&Events |
| 36 | niche.com | 310086 | 141% | Other |
| 37 | khanacademy.org | 302840 | 58% | Other |
| 38 | billboard.com | 301997 | 43% | Media&Events |
| 39 | cnn.com | 300447 | 18% | Media&Events |
| 40 | latimes.com | 294390 | 35% | Media&Events |
| 41 | independent.co.uk | 293324 | 132% | Media&Events |
| 42 | bbc.com | 288138 | 50% | Media&Events |
| 43 | groupon.com | 280787 | 24% | Shopping |
| 44 | theverge.com | 275764 | 67% | Media&Events |
| 45 | ranker.com | 274782 | 150% | Other |
| 46 | nypost.com | 275246 | 79% | Media&Events |
| 47 | seekingalpha.com | 273678 | 293% | Media&Events |
| 48 | people.com | 256276 | 26% | Media&Events |
| 49 | macys.com | 253795 | 41% | Shopping |
| 50 | nih.gov | 251641 | 22% | Other |
| 51 | hulu.com | 250780 | 56% | Media&Events |
| 52 | medicinenet.com | 247817 | 24% | Media&Events |
| 53 | ew.com | 236260 | 88% | Media&Events |
| 54 | foxnews.com | 226718 | 39% | Media&Events |
| 55 | cbsnews.com | 222460 | 54% | Media&Events |
| 56 | commonsensemedia.org | 222645 | 80% | Media&Events |
| 57 | deadline.com | 218977 | 66% | Media&Events |
| 58 | bloomberg.com | 218323 | 29% | Media&Events |
| 59 | medicalnewstoday.com | 215002 | 41% | Media&Events |
| 60 | fortune.com | 216359 | 49% | Media&Events |
| 61 | ldoceonline.com | 206537 | 327% | Encyclopedia |
| 62 | variety.com | 203903 | 46% | Media&Events |
| 63 | microsoft.com | 192272 | 11% | Other |
| 64 | mozilla.org | 187595 | 44% | Other |
| 65 | walmart.com | 184843 | 10% | Shopping |
| 66 | chicagotribune.com | 183058 | 52% | Media&Events |
| 67 | techcrunch.com | 178816 | 59% | Media&Events |
| 68 | buzzfeed.com | 177901 | 38% | Media&Events |
| 69 | engadget.com | 175813 | 68% | Other |
| 70 | investopedia.com | 175317 | 31% | Media&Events |
| 71 | vice.com | 174461 | 91% | Media&Events |
| 72 | 247sports.com | 174314 | 275% | Media&Events |
| 73 | bleacherreport.com | 172586 | 43% | Media&Events |
| 74 | npr.org | 171098 | 28% | Media&Events |
| 75 | newsweek.com | 170135 | 186% | Media&Events |
| 76 | livestrong.com | 169636 | 77% | Media&Events |
| 77 | zillow.com | 169045 | 34% | Shopping |
| 78 | live.com | 166073 | 33% | Other |
| 79 | rottentomatoes.com | 165358 | 13% | Other |
| 80 | retailmenot.com | 165023 | 12% | Shopping |
| 81 | tripsavvy.com | 164500 | new | Media&Events |
| 82 | reverso.net | 164418 | 195% | Encyclopedia |
| 83 | indeed.com | 162933 | 15% | Jobs |
| 84 | aarp.org | 159958 | 102% | Media&Events |
| 85 | agame.com | 157387 | 52% | Other |
| 86 | delish.com | 158025 | 74% | Media&Events |
| 87 | gizmodo.com | 155307 | 48% | Media&Events |
| 88 | sciencedirect.com | 154658 | 162% | Media&Events |
| 89 | businessinsider.com | 153736 | 27% | Media&Events |
| 90 | mayoclinic.org | 153451 | 11% | Media&Events |
| 91 | bestbuy.com | 152577 | 14% | Shopping |
| 92 | spanishdict.com | 149513 | 48% | Encyclopedia |
| 93 | snopes.com | 148612 | 102% | Encyclopedia |
| 94 | techradar.com | 147519 | 71% | Media&Events |
| 95 | deezer.com | 146344 | 71% | Other |
| 96 | coolmath-games.com | 145811 | 48% | Other |
| 97 | pagesix.com | 143935 | 99% | Media&Events |
| 98 | autotrader.com | 140567 | 49% | Shopping |
| 99 | vevo.com | 140429 | 93% | Media&Events |
| 100 | ebay.com | 134447 | 7% | Shopping |
What does it all mean? The cream rises to the top. Companies that focused on delivering quality content, either on differentiated and focused content or on the SEO structure of the site, saw big rewards in the world of Googledom.
Selection of Losers in 2017
In the following, we have identified several domains that fall into the loser category. These are sites that saw a severe drop in their organic visibility during the course of the year. Most domains included here have lost at least 20% of their visibility. However, this does not necessarily mean that the pages have also lost traffic or turnover; it is an indicator of how well represented these domains are in the organic (unpaid) search results of Google.com.
| Domain | Loss of SEO Visibility absolute |
Loss of SEO Visibility in % | Industry |
| reddit.com | 1339420 | -54% | Social Media |
| tumblr.com | 994315 | -79% | Social Media |
| pinterest.com | 922648 | -23% | Social Media |
| giphy.com | 763932 | -85% | Other |
| reference.com | 635112 | -99% | Q&A |
| azlyrics.com | 569666 | -37% | Music/Lyrics |
| tv.com | 523543 | -70% | Media&Events |
| about.com | 453124 | out | Media&Events |
| vimeo.com | 428151 | -50% | Media&Events |
| thefreedictionary.com | 422815 | -27% | Encyclopedia |
| myspace.com | 348804 | -68% | Social Media |
| perezhilton.com | 340110 | -77% | Media&Events |
| wsj.com | 332114 | -43% | Media&Events |
| addictinggames.com | 330743 | -56% | Other |
| allmusic.com | 328659 | -40% | Other |
| infoplease.com | 313584 | -67% | Encyclopedia |
| alexa.com | 292892 | -89% | Other |
| makeuseof.com | 267649 | -73% | Media&Events |
| last.fm | 258315 | -55% | Other |
| patient.info | 250604 | -62% | Media&Events |
| msn.com | 217784 | -29% | Search / Portal |
| justjared.com | 218154 | -54% | Media&Events |
| drugs.com | 203119 | -25% | Other |
| metrolyrics.com | 190898 | -28% | Music/Lyrics |
| popsugar.com | 190342 | -42% | Media&Events |
| autoblog.com | 188263 | -65% | Media&Events |
| inquisitr.com | 173651 | -85% | Media&Events |
| consumeraffairs.com | 167121 | -40% | Other |
| wordpress.com | 161463 | -34% | Other |
| foursquare.com | 161074 | -64% | Other |
| cinemablend.com | 158786 | -67% | Media&Events |
| dailymotion.com | 155299 | -43% | Media&Events |
| instructables.com | 148539 | -57% | Media&Events |
| mapsofworld.com | 147512 | -76% | Other |
| quora.com | 147189 | -38% | Social Media |
| nymag.com | 144320 | -38% | Media&Events |
| babylon-software.com | 139714 | -91% | Other |
| hotmail.com | 115109 | -52% | Search/Portal |
| goodsearch.com | 133433 | -46% | Shopping |
Winners and Losers by Industry
To identify the industries and relevant trends for the winners and losers whose Visibility on Google.com changed in 2017, we extended our industry and data sample. Instead of using the top 100 winners and a selection of losers, we have categorized the 250 domains with the greatest increase in SEO Visibility, and the 250 with the greatest decrease.
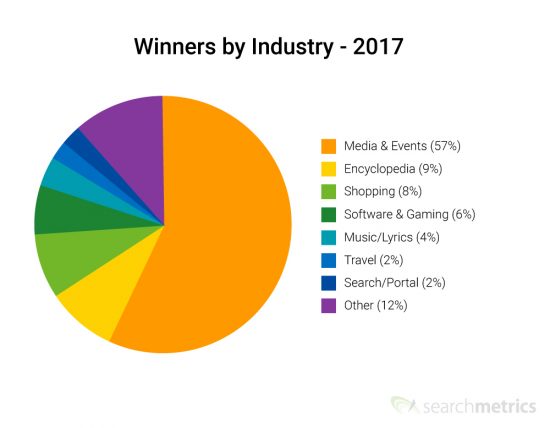
Publishers (media & events) made up 57% of the biggest winners in 2017, and 8% were shopping websites. The proportion of encyclopedias (including dictionaries) amongst the winning domains stood at 9%:
 Of the websites that lost out in 2017, 44% are also from publishing (media & events), while shopping websites also comprise 12% of losers:
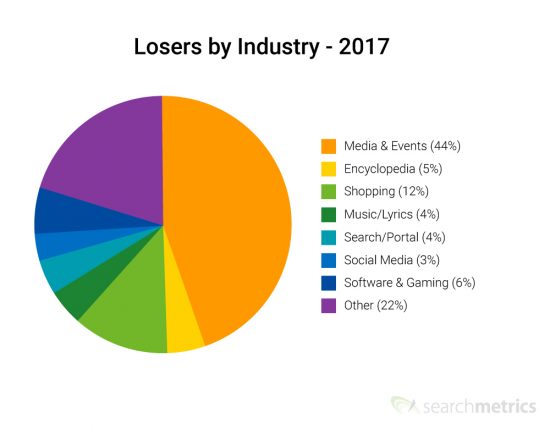
This shows that there has been much fluctuation within industries: 57% of the winners are publishers, but so are 44% of losers. It is similar with shopping websites. They make up 8% of winners but also 12% of losers. Another area represented in both categories is software/games: 6% of winners and 6% of losers.
Let’s now look at the differences and try to find out which industries really won or lost.
- Amongst the winning domains, there are clear gains for encyclopedias and dictionaries. Google increased the presence of these domains in its SERPs in 2017, so that 9% of the winning domains belong to this industry. Large increases in SEO Visibility were experienced by domains like dictionary.com, britannica.com and thesaurus.com.
- When we look at the losers, we see that many of them come from the category search/portal – domains like msn.com. Another group that is well-represented amongst the losers is music/lyrics – e.g. azlyrics.com or metrolyrics.com. Several social media websites are also found in the loser list. In fact, the top 3 losers were all social media websites: reddit.com, tumblr.com and pinterest.com.
Analysis: 2017 Search Trends
Google Updates, mobile-first index, content quality and ads. Here is a quick summary of the most important search trends of 2017, and an analysis of their impact on SEO Visibility.
Impact of Google Updates
The following graph shows the average SEO Visibility of the winners and losers on a weekly basis throughout 2017. We have included the most important Google Updates:
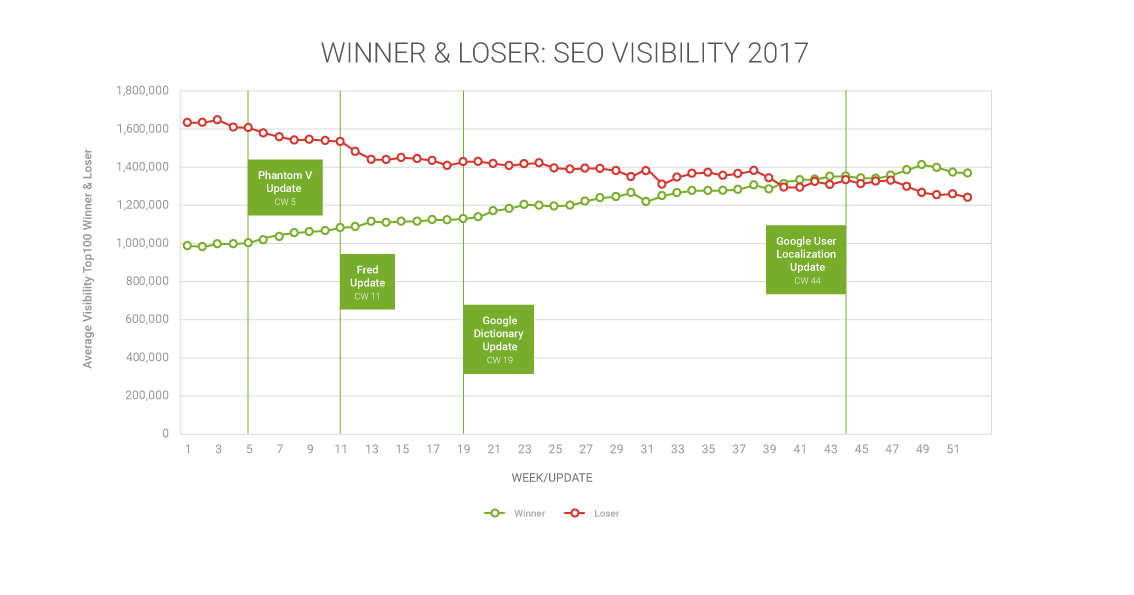
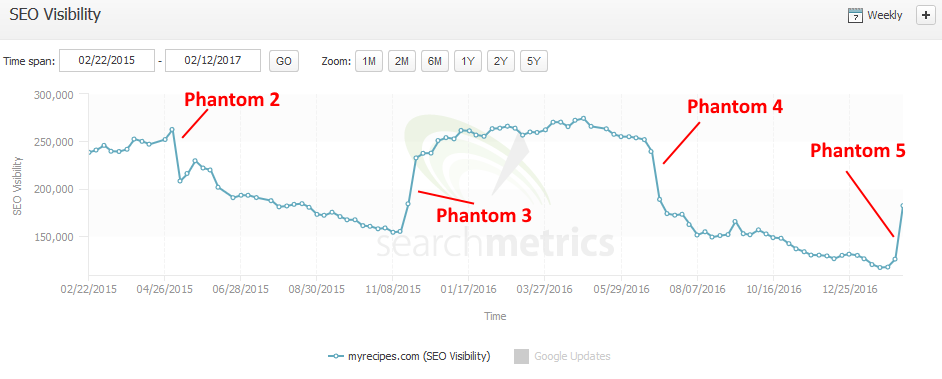
Phantom V Update: Though unconfirmed by Google, early February saw an algorithm update: Phantom V. The update targeting quality led to drops in Visibility – e.g. for foursquare.com – or significant increases – for domains like tvtropes.org. This update helped these websites take their place in the year’s top lists. Many websites affected by Phantom V had already been hit by earlier iterations of the Phantom, e.g. myrecipes.com:
- Fred Update: Another update that was not confirmed by Google bears the nickname “Fred”. This came in calendar week 11, which was the most turbulent of the year. According to searchengineland, ad-heavy websites with low-quality content were worst affected by this update.
- Dictionary Update: In June 2017, an update created (more) Visibility improvements for dictionary domains. URLs for dictionaries improved their rankings first and foremost for short-tail keywords that could have various different user intents,
- Google User Localization Update: Since October 2017, users are given search results based on their current physical location, regardless of the top-level domain (e.g. Google.com/Google.co.uk) they enter into the address bar.
Big wins for dictionaries
As mentioned above, online enyclopedias and dictionaries are amongst the biggest winners of 2017 (besides publishers). The trend that has seen Google ranking these domains for short-tail keywords that do not have one clear user intent (e.g. to purchase) continued throughout the year. As a result, six positions in 2017’s top 10 list of winning domains are dictionaries. Here are a few examples of how selected encyclopedias fared in 2017:
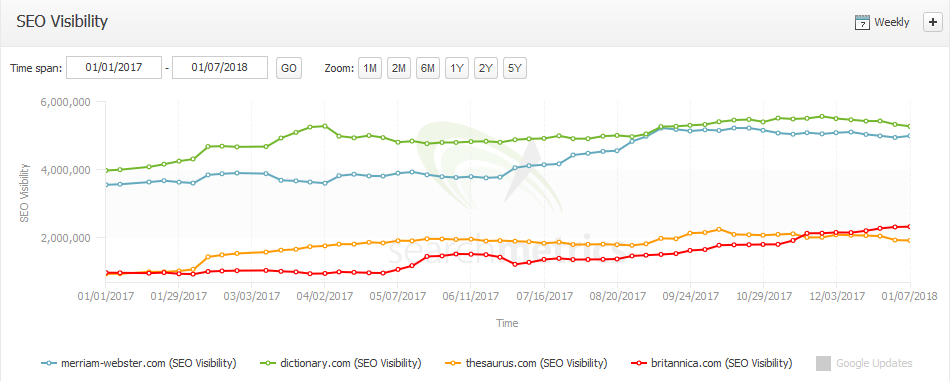
Towards the end of 2017, these domains started to lose momentum, so we will have to wait and see what Google has in store for dictionary websites in 2018.
Losers losing even more on mobile
Domains that lost out in 2017 also saw bigger drops in Google’s mobile index than on desktop. At the start of the year, desktop and mobile visibility were often around the same, yet as the year progressed, many domains – even though they had mobile versions – saw much greater losses on mobile than on desktop. For example, tv.com’s mobile visibility was 41% below its desktop visibility as the year closed, for perezhilton.com it was 42% lower and allmusic.com had a mobile visibility 43% below its desktop performance.
And the winner is… excellent content
Our analysis of 2017’s best performer shows that investing in high-quality content that perfectly serves the user intent is a great way to be rewarded with top search engine rankings. One highly noteworthy development this year: about.com is history. The internet pioneer of yesteryear, with its archetypal content farm, has been on the downward spiral for several years now. The domain often had many texts on the same topic with a similar format: max. 300 words, not very useful, optimized for a highly specific (long-tail) keyword phrase.
Now: A succesful relaunch and split into five separately branded vertical sites has been completed. The new sites include Verywell (Health), Lifewire (Tech), The Balance (personal finance), The Spruce (home and food) and ThoughtCo (education). And the new umbrella brand is now called dotdash.com.
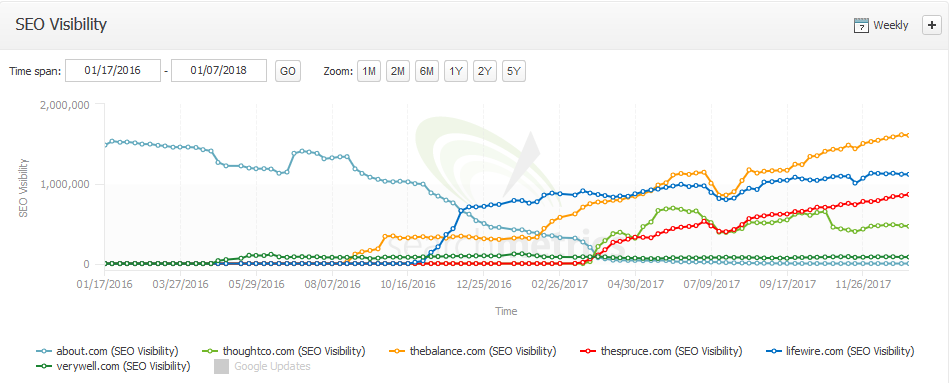
The pale blue line shows how about.com’s Visibility falls and ultimately disappears. The other lines show that each of the individual verticals is on course to reach the visibility of the old site. On their own! In total, this means five times the visibility of the old about.com. Congrats about.com, ahm dotdash.com. Great job in diversifying and creating a better user and content experience.