“Since April 2007 search engine result listings have been more than just a series of 10 blue links. Almost six years ago Google began to integrate boxes containing additional media which appears in-between the actual organic search results. Those – depending on how relevant they are to the search query – also generate higher click rates…”
These are the introducing lines of our new Universal Search study which is available as a white paper to be ordered now. With great work effort we analyzed the search results for millions of keywords and evaluated a lot of data.
The Universal Search year 2012: White paper download
Our white paper, including a cool infographic, is an analysis of Universal Search integrations in Google search results and specifically their distribution, number and development in the USA for 2012.
The initial, general observation: over the whole of 2012 the proportion of keywords with at least one Universal Search integration declined in the USA.
In the beginning of 2012 the proportion was still about 86% high. But during the year the percentage dropped to 75% (status December). It seems that Google is optimizing Universal Search and is actually only displaying additional results when the user is expecting them.
The significant trends in short:
- A dramatic reduction in the number of shopping integrations displayed in Google search results during 2012 – which appear to coincide with the switch to a paid model for Google Shopping in the USA.
- A reduction in the number of video integrations which have long been the most frequently displayed integration.
- An increase in the number of news integrations and a rise in the overall number of news sources for which news integrations are displayed
Video and shopping integrations are declining, images and news are gaining ground
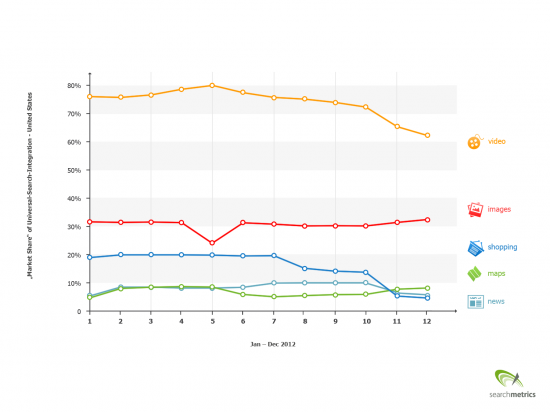
In a detailed view on the distribution of integrations of videos, shopping, images, maps and news, a clear trend becomes apparent from about halfway through the year: image integrations gain at the expense of video one boxes which have had a substantial lead for many years. Moreover shopping integrations keep falling.
The graphic shows the market shares of the individual types of integration within google.com. As you can see over the course of 2012 – especially towards the end of the year – there was considerable movement in Universal Search.
Note: Although there are search results without Universal Search integrations the total of all One Boxes is, of course, over 100%. Often several integrations are simply displayed simultaneously for a given keyword.
Percentage trends and growth rates
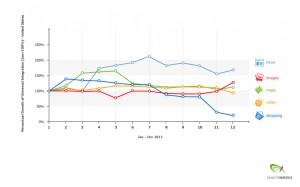
How about the percentage trends? Let’s have a detailed look at the growth rates of the total numbers.
The increase in image integrations, the decline in video (comparatively “slight” over the course of the year) and the (by contrast, drastic) drop in shopping One Boxes are shown clearly here. Equally noteworthy in this context, however, is the obvious rise in news integrations in Universal Search, which amounts to about 160% in the USA over the whole of 2012. On the other hand map integrations in Universal Search showed positive growth at the start of the year but decreased again towards the end of the year.
Shopping: Loser of Universal Search in 2012
From the middle of 2012 very few direct links to shopping providers such as Amazon or Sears were shown in the Universal Search integrations. Rather, in the shopping boxes Google primarily provides links to results pages within Google itself. The offers from other providers are then brought together. From there, users can then click through to the provider or to product pages.
In the USA has been a charge for inclusion and display on these Google shopping pages since the middle of 2012. Google now requires providers to pay for the privilege of appearing in shopping integrations. At the same time it is noticeable that the presentation or listing of shopping results within Google shopping is not sorted by product price.
Video: “You don’t mess with YouTube”
YouTube, Google’s own video service, has been the measure of all things as far as video integrations in Universal Search are concerned. The other providers, which include not just those who offer video services, have a very low market share – even when combined – and this also declines slightly over the course of the year. Throughout the second half of the year 2012 four out of five video integrations came from YouTube.
In the USA, the average first video integration of YouTube (rank eight) is about two positions ahead of the average first position of a competitor’s video (rank ten).
News: What’s new?
As far as percentages are concerned, news is the integration that shows the biggest proportional increase in 2012. In other words, there are more and more keywords for which news integrations are displayed. Not only that, but the number of integrated news items per One Box is increasing as well.
Also, the number of news sources has risen significantly. So the increase in news integrations in Universal Search is linked to an increase in news sources. Not only are more news items therefore being shown from the same news sites, but in the course of 2012 a wider variety of news providers were represented in Universal Search than at the beginning of the year.
This is a good sign, as greater diversity is desirable in the field of news. Therefore opportunities also open up for small providers to position themselves well in the field of news and to attract a lot of traffic through news integration, which is usually shown right at the top in current results.
Infographic and my summary of Universal Search 2012
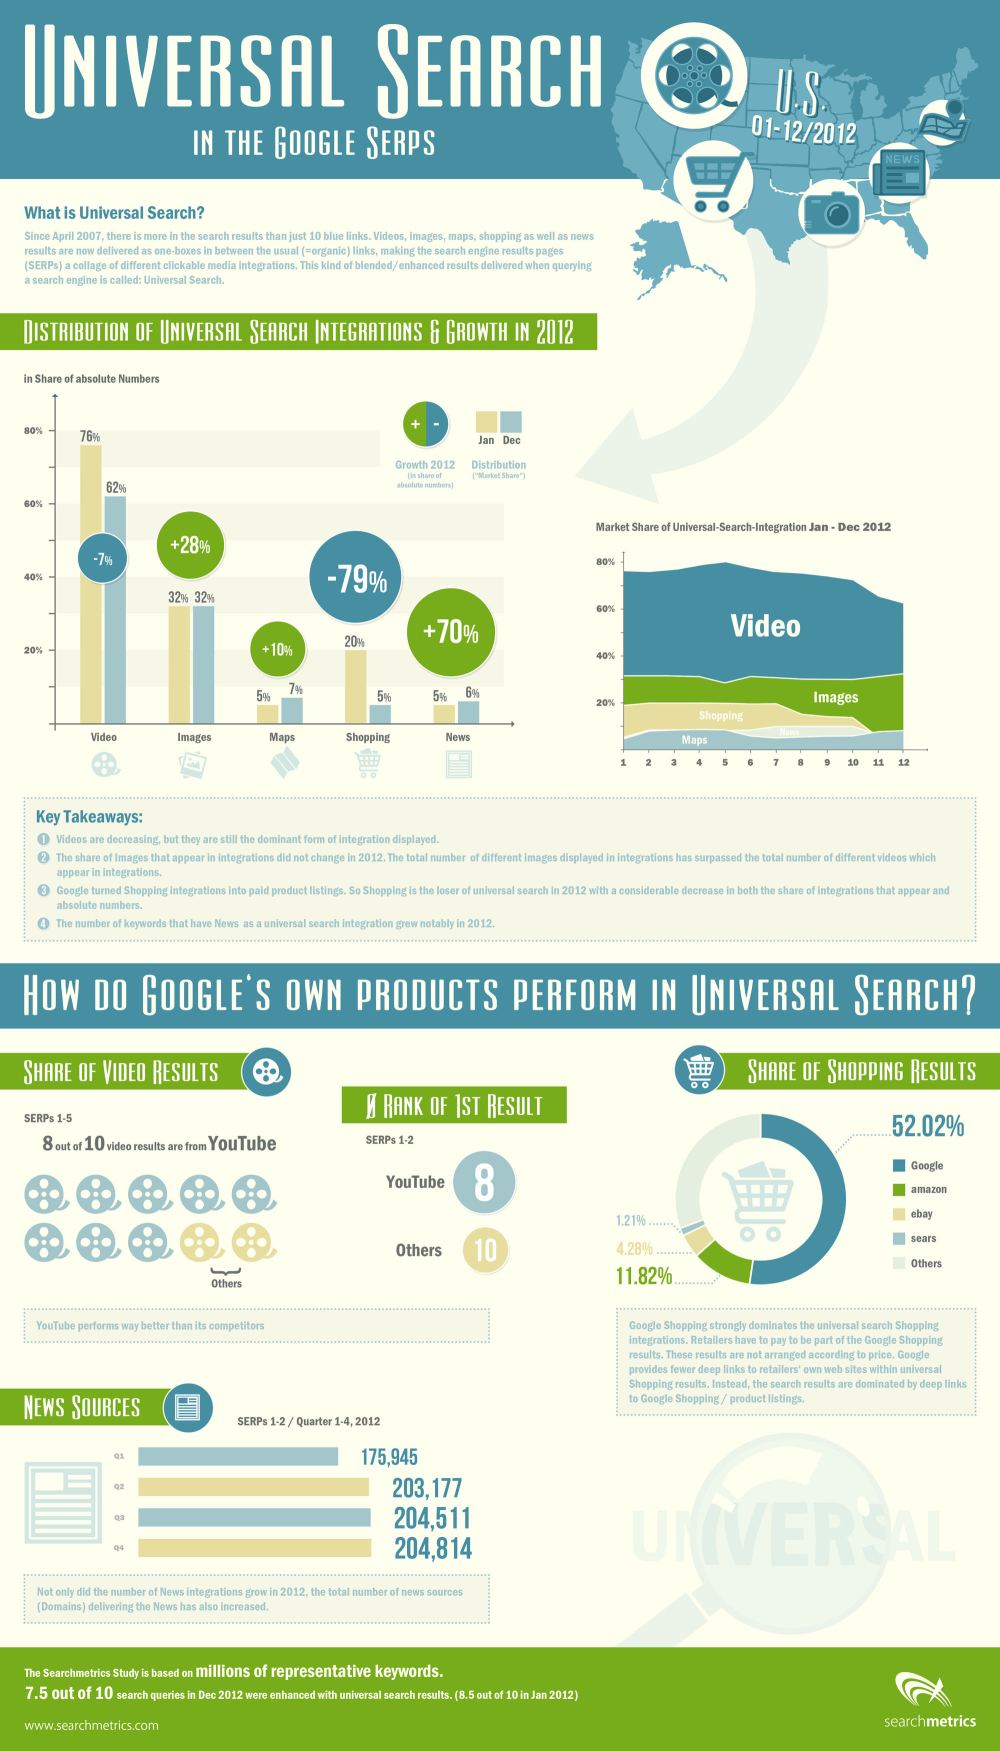
Last but not least, I want to introduce our infographic, summing up our analyses, to you:
…and finally, here are the most important developments in Universal Search in 2012, condensed:
- Video integrations have fallen continuously since the middle of 2012.
- The integration of images in Universal Search has increased slowly but steadily, especially in absolute figures.
- Shopping is the loser in 2012. This will probably continue in 2013, as Google will be including only shopping ads that have been paid for in the long term.
- The percentage of map integrations has remained more or less constant or has increased slightly.
- News integrations have roughly doubled in terms of percentage growth – and the number of news sources has also risen.
As far as the detailed analysis of the two losers – shopping and video integrations – is concerned, a preference for Google products is evident within these types of integration. Three out of four video integrations come from Google (YouTube). As far as shopping is concerned, too, three out of four integrations are from Google Shopping.
In general, Google tends to cut back on displaying Universal Search integrations in the search results. In the USA, the proportion of keywords with integration has declined by about 10% in the course of 2012.
What are your thoughts concerning our analyses? Let us know your takeaways and let’s have a discussion via the comments!


